Microsoft Certified

We have an in-house Microsoft PowerBI certified team of Developers, Data Scientists and Data Analyst.

Dedicated Support

Our expert team is available for support in 1300 CST and 0530 IST Timezones.

5+ Years Experience

We are proud to be an early adopters of Data products and tools that are now industry standards.

Custom Frameworks

Our experts has developed in-house data science framework to help speed the turnaround time.

data-visualisation-designmockup

Our Power BI expertise

Effective Power BI Consulting and Implementation Strategy

Consulting

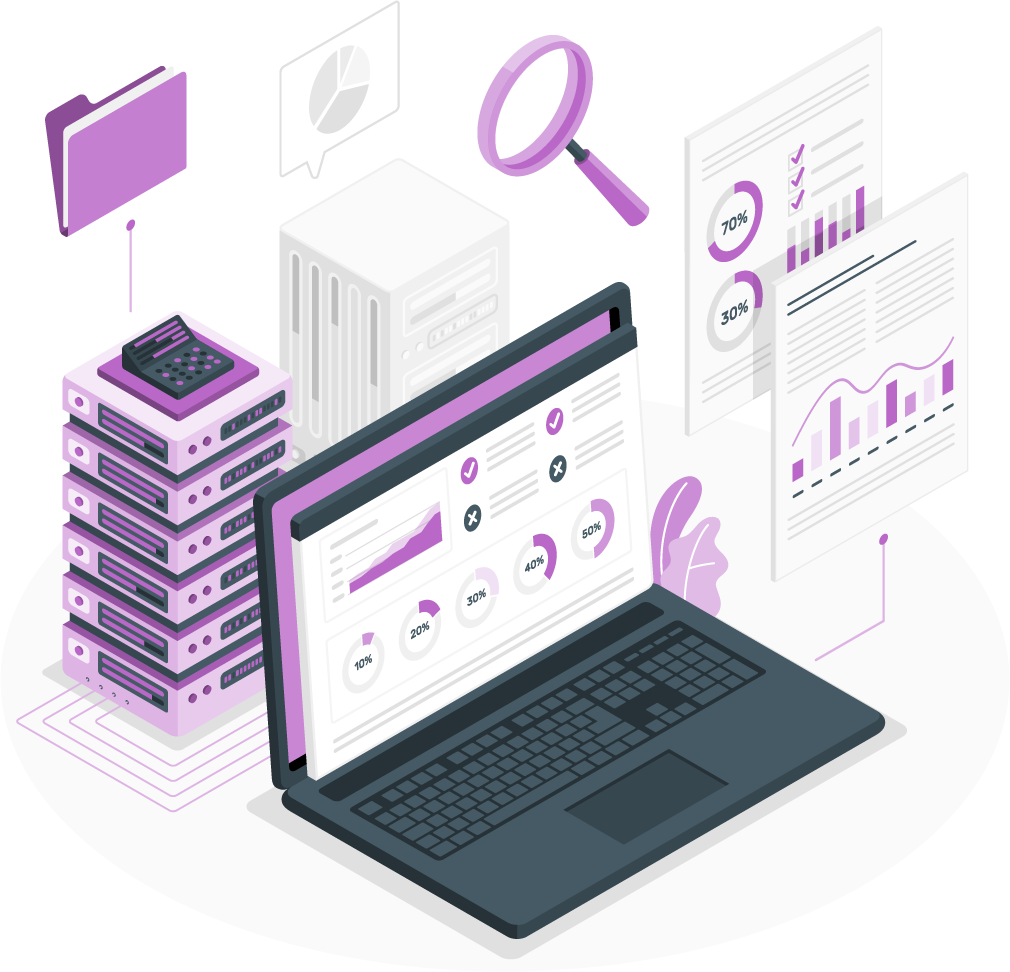
From creating a roadmap to strategizing data plan to evaluate and implement a modern BI platform for your business, our Power BI consultants guide you through the entire journey.

Powerful Integration

With our Power BI integration services, you can get access to disparate data sources, enhance data exploration and uncover insights hidden in your data.

Dashboard development

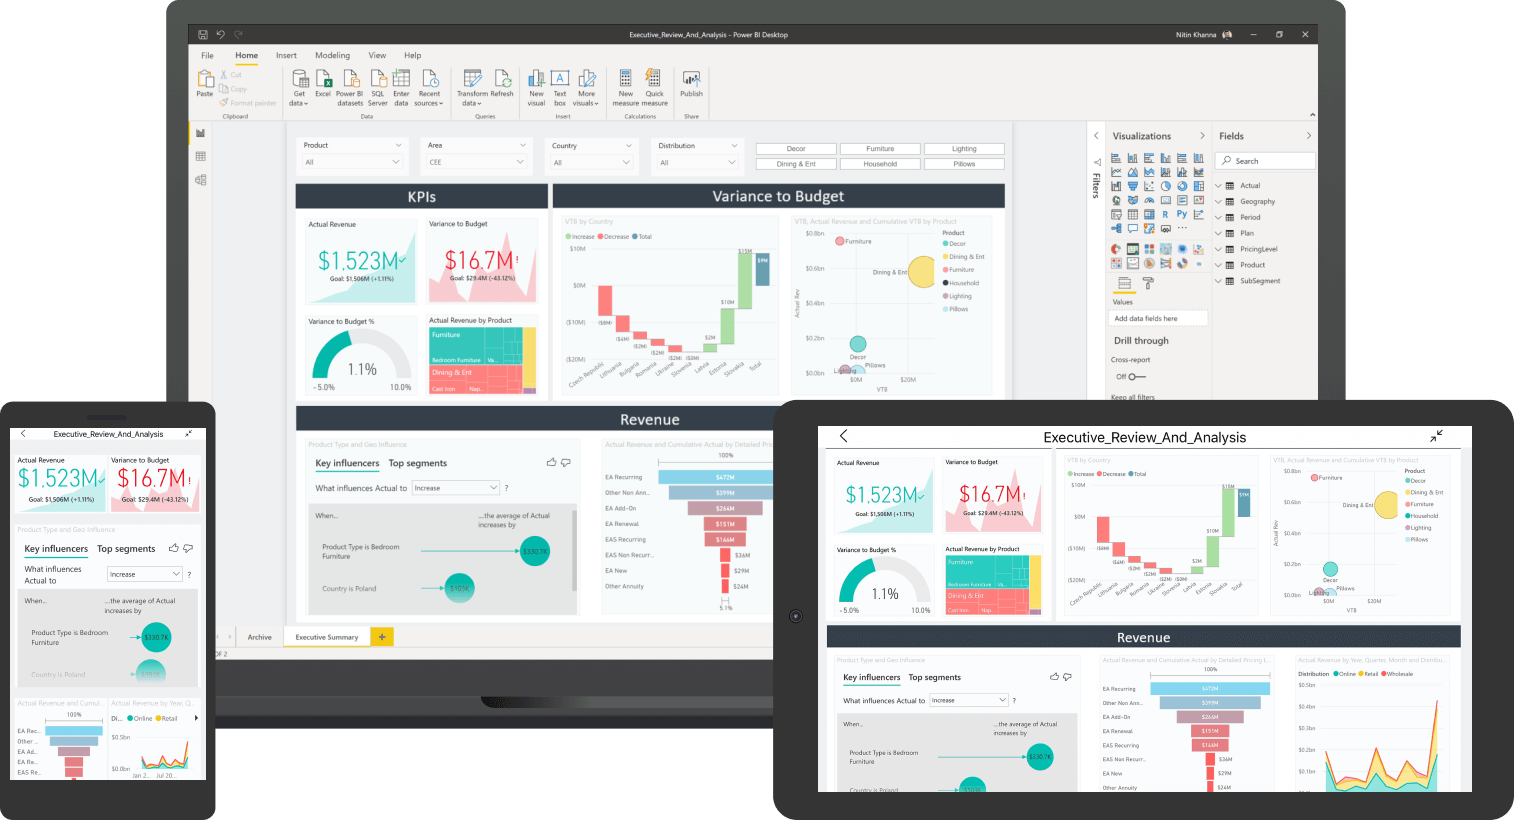
With customized dashboards and interactive reports developed by our BI experts, you will be able to make quick and savvy business decisions.

Data Visualisation Use Cases

Explore sample industry and domain specific analytics built using AWS QuickSight.

HR-Dashboard-PowerBI

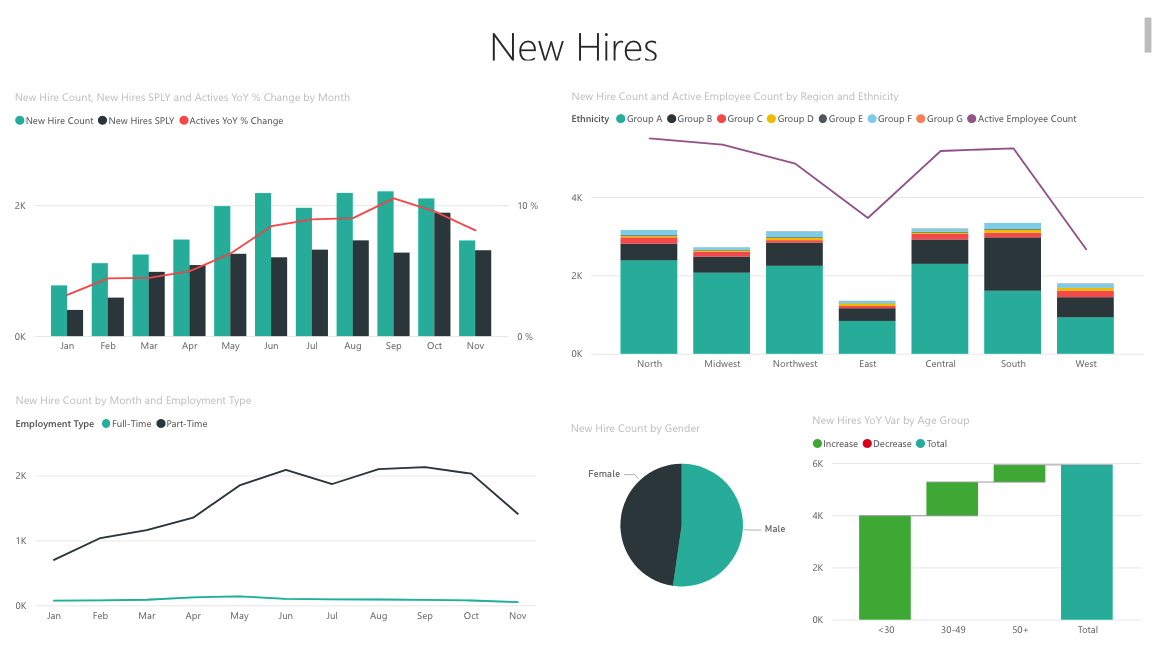
Human Resources Sample

This underlying report analyzes HR information. This sample looks at new hires, active employees, and employees who left and tries to uncover any trends in the hiring strategy. Our main objectives are to understand who we hire, biases in our hiring strategy, and trends in voluntary separations.
Sales-Marketing-Dashboard-PowerBI

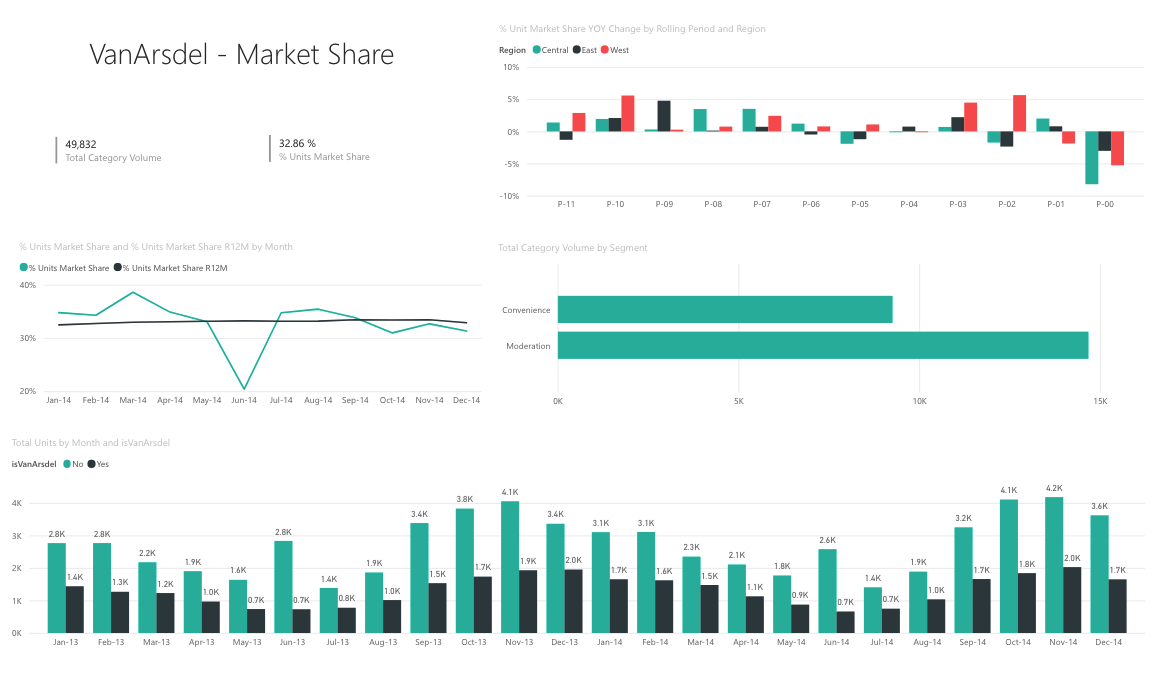
Sales & Marketing Sample

This underlying report analyzes a manufacturing company's sales and marketing data. This dashboard was created to keep an eye on the industry and company's market share, product volume, sales, and sentiment.
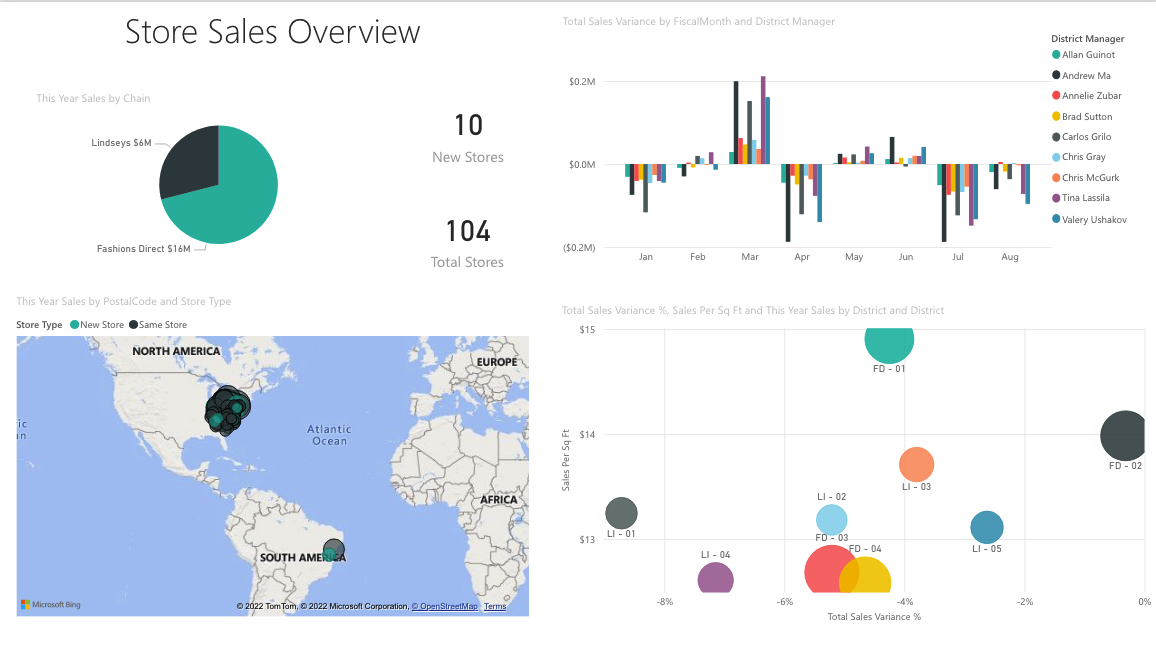
retail analysis dashboad power bi

Retail Analysis Sample

This underlying report analyzes retail sales data of items sold across multiple stores and districts. The metrics compare this year's performance to last year's in sales, units, gross margin, and variance, as well as new store analysis.

Data Visualisation Process Flow

For growing companies, Data visualization is the essential part of the business to make business strategies. Each and every data has its particular need to illustrate data. Listed below are the stages and process flow for Data Visualization.

Acquire

In this step, the entire datasets are obtained or fetched from a variety of sources. The source may be a file or a disk or a networked system. Tables generated after conducting surveys or study reports also constitute datasets to be acquired for data visualization.

Parse

Most often, the raw datasets are unorganized and unstructured which are difficult for analysis and visualization. Therefore, the data needs to be restructured into different categories, which helps better visualize and understand data. Such structuring and organization of data may be done based on tags, indices, and names.

Filter

In this step, the data that is unnecessary concerning the current point of view for analysis and visualization is filtered out. The data to be filtered out may be crucial for the point of view for some other data analysis or visualization; therefore it must not be assumed it is less important.

Mine

The filtered data that needs to be analyzed is now mined by applying various mathematical and statistical formulae upon it. This process converts the filtered data into variables denoting values or quantities that help viewers seek insights that cannot be gained from raw data or statistics.

Represent

One of the biggest challenges is to decide which visualization form is most suitable and represents the right information. The data exploration capability is necessary to statisticians as this reduces the need for duplicated sampling to determine which data is relevant for each model.

Refine

Refining and Improving the visualization for it to be more engaging, captivating, and enriched. To achieve this, various graphic design tools and technologies are used. Online reports, charts, and dashboards usually bank upon technologies such as HTML5, CSS, and SVG for achieving the purpose.

Interact

An essential quality of digital dashboards and charts is interactivity; the user should be able to select varying data ranges, time intervals, and chart forms for analyzing a dashboard according to multiple viewpoints.

Why Choose Elitech?

microsoft gold partner

Specialized technology expertise

Customers hire Elitech Systems for highly complex and innovative projects for mainly two reasons. Experienced and super-smart engineers backed by industry-specific blueprints; and a collaborative engineering culture where all team members speak the same language, share the same values, and solve problems together.
data management and visulization

Industries
We Work With,

Select right software partner that can bring your ideas to life.

Each developer at Elitech has an acute understanding of the tremendous benefits a well-executed project can bring to a business in any of the industries we serve. That is why the Elitech team goes to great lengths to develop effective and timeless solutions to help enterprises and government organizations achieve their goals with precision and speed.

agriculture icon

Banking & Finance 

project icon

Construction

goverment icon

e-Governance

online-course icon

Education & e-Learning

ecosystem icon

Energy

Healthcare

restaurant icon

Hospitality

Logistics and Distribution

manufacture icon

Manufacturing

conference icon

Meetings & Events

real-estate icon

Real-Estate

shop icon

Retail & FMCG

We’ve worked for

Some of the amazing Companies

adani logo
novomet-logo
NiBILL
bharatcall logo
SpyGlass appraisal

FAQ

Some of the Most Frequently Asked Questions about Microsoft Power BI

The Power BI service is a cloud-based business analytics service that enables anyone to visualize and analyze data with greater speed, efficiency, and understanding. It connects users to a broad range of cloud-based and on-premises data through easy-to-use dashboards, interactive reports, and compelling visualizations that bring data to life.

Power BI Premium is a capacity-based offering that includes:

  • Flexibility to publish reports broadly across an enterprise, without requiring recipients to be licensed individually per user.
  • Greater scale and performance than shared capacity in the Power BI service.
  • The ability to maintain BI assets on-premises with Power BI Report Server.
  • One API surface, a consistent set of capabilities, and access to the latest features for embedded analytics.

Power BI Premium recently released a new version of Power BI Premium, Premium Gen2. Premium Gen2 simplifies the management of Premium capacities, and reduces management overhead. For more information about Premium Gen2, see Power BI Premium Generation 2.

Microsoft Power BI Embedded (PBIE) allows application developers to embed stunning, fully interactive reports into their applications without having to build their own data visualizations and controls from scratch.


Power BI Embedded recently released a new version, called Embedded Gen2. Embedded Gen2 will simplify the management of embedded capacities, and improve the Power BI Embedded experience. For more information, see Power BI Embedded Generation 2.


Yes. Power BI has native apps for Android phones and tablets, iOS devices, and Windows 10 devices.

ower BI supports these browsers on all platforms where they’re available:

  • Microsoft Edge
  • Chromium.Chrome desktop latest version.
  • Safari Mac latest version.
  • Firefox desktop latest version. Firefox may change the fonts used in Power BI.

The Power BI service (in the browser) is available in the following 44 languages:

  • Arabic
  • Basque – Basque
  • Bulgarian – Български
  • Catalan – català
  • Chinese (Simplified) – 中文(简体)
  • Chinese (Traditional) – 中文(繁體)
  • Croatian – hrvatski
  • Czech – čeština
  • Danish – dansk
  • Dutch – Nederlands
  • English – English
  • Estonian – eesti
  • Finnish – suomi
  • French – français
  • Galician – galego
  • German – Deutsch
  • Greek – Ελληνικά
  • Hebrew
  • Hindi – हिंदी
  • Hungarian – magyar
  • Indonesian – Bahasa Indonesia
  • Italian – italiano
  • Japanese – 日本語
  • Kazakh – Қазақ
  • Korean – 한국어
  • Latvian – latviešu
  • Lithuanian – lietuvių
  • Malay – Bahasa Melayu
  • Norwegian (Bokmål) – norsk (bokmål)
  • Polish – Polski
  • Portuguese (Brazil) – Português
  • Portuguese (Portugal) – português
  • Romanian – română
  • Russian – Русский
  • Serbian (Cyrillic) – српски
  • Serbian (Latin) – srpski
  • Slovak – slovenčina
  • Slovenian – slovenski
  • Spanish – español
  • Swedish – svenska
  • Thai – ไทย
  • Turkish – Türkçe
  • Ukrainian – українська
  • Vietnamese – Tiếng Việt

Power BI Premium is a capacity-based license, while Power BI Pro and Premium Per User (PPU) are user-based licenses. Power BI Pro is for those users publishing reports, sharing dashboards, collaborating with colleagues in workspaces and engaging in other related activities – such as the ability to:

  • Edit and save customized views
  • Create personal dashboards (pin to new dashboard)
  • Analyze data in Excel or Power BI Desktop
  • Share with Excel Web App support
  • Share dashboards and collaborate with Microsoft 365 Groups
  • Integrate content with Microsoft Teams

A Premium Per User (PPU) license includes all the functionality of a Pro user, plus additional capabilities.


A capacity is an amount of computing power that is reserved to your organization for its Power BI utilization. It is provisioned by a service admin through the Power BI Premium admin portal, in the Capacity Management page.


You have several options to get your data into Amazon QuickSight: file upload, connect to AWS data sources, connect to external data stores over JDBC/ODBC, or through other API-based data store connectors.
Schedule a meeting